During one Saturday in the beginning of November, I took part in a multi-party negotiation, which had some surprising results. Out of curiosity, I mapped who wanted what from whom, and ran a basic network analysis. The second surprise of the day was the analysis was really close to the observed results. I hope this description of my network analysis of a common game theory problem spurs discussion about how use network analysis and game theory in combination.
Tag: analysis
Friendship: #1 factor in whom we spend time with

Like all good science, analyzing social networks sometimes works out to proving things we always thought were true. Sometimes, we never even had any idea how right we were. For example, we really do spend more time with people we like.
A few really bright folks from MIT and the Kennedy School, have a paper pending publishing:
[analyzing] 330,000 hours of continuous behavioral data logged by the mobile phones of 94 subjects, and compar[ing] these observations with self reported relational data.
Three significant conclusions:
- Self-reported data shows a mildly positive relationship with observed data, but is exceptionally noisy.
- Friendship outside of work is the best indicator of who spends time with whom at work.
- Physical proximity is a good indicator, and predictor, of friendship (and not-friendship).
So, what do these conclusions suggest for practitioners?
Observed vs Reported Data: Surveys are great for all the reasons surrounding explicit participation, but the bias effects are significant. Find a way to marry active participation with empirical exploration and analysis of social networks.
Friendship and After-hours: Don’t under estimate the power of emotion on business decisions. Since we’re more likely to agree with data that confirms any already held thoughts, let’s be realistic and recognize the impact that, viewed through friendship, has on communication in our firms.
Proximity and Friendship: While I was unable to tease out any correlation/causation relationship from this paper, if we consider friendship as a proxy both for trust and ease of ability to work with (through shared history, goals, culture, etc.), there are some solid implications on the upper limit to the value of outsourcing.
[Photo by Ed Yourdon]
Lower Limits on Social Network Analysis: Just Ask
Are there lower limits to the size of Social Networks worth analyzing? The upper limit seems to be a function of how much time (and compute power) you have, but the lower?
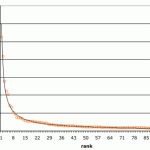
When we do analyses, these are certain characteristics we look for as verification that our models hold. A key characteristic is the shape of the distribution of the number of relationships.


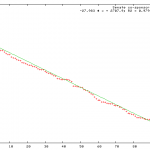
Power-law relationships in social networks are so pervasive, we are surprised when we do not see them. The co-sponsorship of Senate Resolutions, is one such example where we do not see a power-law distribution. In the current session, the 110th, the distribution is just about as different as you can get from a power-law: the result is linear (R-sq > 0.97). My hypothesis is the number of Senators is just too few for the power-law distribution to emerge.
Since there are some significant constitutional barriers to increasing the number of Senators and taking a new sample, in order to test this hypothesis, I opted for locating a different larger set. Wanting to find a network with similar culture and behaviors to control where possible for other variables, I analyzed the House Resolutions from the same period.

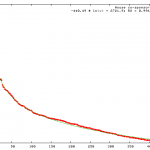
Running the same test across the House Resolutions (1,986 resolutions vs 784 in the Senate), the shape was still not best fit to a power-law. Instead, a logarithmic fit was near perfect (>0.99 R-sq). So, while his does not prove my hypothesis, the shape of a log fit is similar to, but less dramatic than, power-law. This result certainly suggests further exploration.
One possible logical conclusion is distribution forms change with scale. Much of the research on social networks has been on large scale networks, where the math is at its most difficult. At this smaller end of spectrum, especially with the Senate, the networks may be small enough that other analyses could be simpler.
Anthropologist Robin Dunbar, has done research showing humans can keep the interrelations of about 150 people in their heads. More than that number, and we are out of luck. With this in mind, it would make sense that relationship/contact distribution would stretch and distort as the number increases in scale.
So, if you are looking for the key members of a network smaller than “Dunbar’s Number,” there is an easier way to find out who they are: ask. If you can get a few people who are already invested in the network to answer you truthfully, they will be able to give you a really good idea who the key people are.
Social Networks of the Senate

I always enjoy analyzing social networks (SN’s) that have had a lot less press than the Goliaths of MySpace and Facebook. I have done an awful lot of them, but one of my favorites was looking at the co-sponsorship patterns in the US Senate, 110th session (the current one).
This analysis was especially enjoyable because the graph is just one giant cluster, so conclusions took some real digging. So, what did we learn?
We learned a few things: graphs are just the beginning of analysis (but we knew that already); not all junior Senators are as strategic as others; and directionality of the relationships can have a large impact.
There are a handful of junior Senators setting themselves up for favor by strategically co-sponsoring specific bills. However, most junior Senators are building reputation by supporting anything that makes it to the floor. I am going to have to go back and analyze previous sessions to see which approach seems to provide the better payoff.
Relationships by-and-large are unequal between participants. Sometimes they are very close, sometimes they are very different. In our analysis of the Senate, many of these relationships are very unequal; a junior Senator is much more likely to co-sponsor a bill of a senior Senator than vice versa. Without bringing this inequality into play, our notion of network centrality is challenged. In this case, the two Senators most central include one first elected in 2004, followed closely by one who is a member of the powerful Senate Appropriations Committee. If we view networks as expressions of influence over flow of information, including favors, that just doesn’t make sense.
When we start to bring directionality into consideration, which I did by splitting out the sponsors and co-sponsors for half of the Senate’s 104th session (1995); results become much more as expected. The most central Senator was John Warner, then president pro tem.