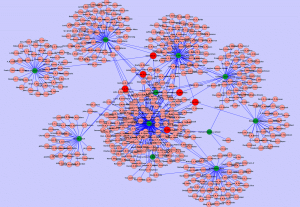
 In honor of the Iranian election, here’s the 2001 social network analysis of the Iranian government by Renfro and Deckro.
Tag: analysis
Statistics::SocialNetworks Perl mod is live!
 Statistics::SocialNetworks has just been uploaded to CPAN, and as it percolates through the system I put forward the question, “What are we going to do with it?”
My goal in getting a module into CPAN is easy access, and a starting point to where we can decide what tools we want, and not have to reinvent them every single time. There’s good work beginning in R, Python, and probably lots of others, but I’m a Perl-guy and I’d like this to be an open and ongoing discussion.
Included so far, are measurements of the Burt Constraint, and the Coleman-Theil disorder index.
What would you like to see?
P.S. SNA of Iranian Gov’t
Election Influence by 527’s: Browsable Map
I wanted to put out what’s been done so far on making yesterday’s post more interactive. There’s an awful lot that could be better about this map. Particularly legibility of labels in the core (it’s just too dense). If you want to see names, I suggest looking at the edges of the map.
Michael Bommarito is looking into better layouts for legibility. And while you are waiting, I suggest getting your fill of everything he’s ever written.
The data was collected from OpenSecrets.org.
[21-Apr-2009: You should see a flash image above, but am having an awful time getting this to render on a Mac. Works great on Linux (Red Hat Enterprise Linux).]
Influencing Elections: Network of Expenditures by 527s
OpenSecrets.org is offering free access to their collected data about political contributions, and in that vein, I’ve created a network of expenditures by 527’s*. I am looking for a way to make this more detailed for your ease of exploration, so please stay tuned.
*Groups whose primary purpose is to influence elections are exempt from taxation under Section 527 of the Internal Revenue Code. From NP Action.
Network Analysis Application to Game Theory (with Software)
When will network analysis provide additional insight into game theory? In a word: inequality.
There must be some form of quantifiable inequality in the game: access, strength of relationships, goals, etc. This difference creates opportunities for the individual players to use information (or resource) asymmetries and broker to their benefit.
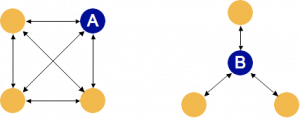
On the left all of the arrows representing the relationships have the same weight, representing the same value, in both directions and between all nodes. On the right, the arrows have different weights between nodes. The greater the inequality, the more effective the application of network analysis.
The relationships depicted could be import/export pairs ($ or volume), contract frequency, or even strength of social relationships. Do not underestimate the potential utility in measuring based on qualitative values, such as strength of relationships. Using them can not only be quite effective, but they can often be much easier to calculate than one might suspect at the onset. Here’s why.
The analysis method I suggest looks at all of the weights relative to the originating node. It does not matter whether you can accurately value A’s relationship to B versus B’s relationship to A, as long as you can compare A’s relationship to B versus A’s relationship to C. From the point of data collection, even an intuitive estimation these comparative values will provide insight. Thus knowing A wants something from B more than A wants the alternative from C, is often sufficient.
Looking at the perspective of access, this is represented in the shape of the network as “holes” or gaps. There are technical definitions, but it’s usually quicker to understand through an image. Compare:
 From the perspective of the two darker nodes A and B, they clearly have different opportunities to act as brokers based on the holes (or lack thereof) in the network.
Using the two of these together has shown some promising results.
Here is a simplified version of one of the tools I wrote to calculate the opportunity to act as broker based on the value of relationships and the network. The TAR file contains the simplified program written in Perl, and two sample CSV network files: one similar to each network in the second image. The program relies on a module not yet indexed by CPAN, but is available there.
The calculation is called the network constraint, after Ronald Burt’s work. The lower the constraint, the larger the opportunity to act as a broker, i.e. perform well in the game based on network structure.
I am in the process of requesting CPAN to host the Perl module, in registered space, so stay tuned.
[for an older version of the code, with some egregious bugs, but all in one place and no extra downloading, get it here]
Graphing Wall Street with LittleSis.org
With a goal of transparency,  LittleSis.Org has started collecting peer-membership information for public figures of many sorts. Just the stuff made for social graphs!
This is image represents the social networks of the CEOs of the American Wall Street companies, from the info at LittleSis. Red nodes are the CEOs (Thain is included), and green are organizations.
The data is a work in progress, as it only represents a few organizations these folks are involved with; but a work in progress is progress indeed.
P.S. LittleSis: API pretty please!
Complete(?) Kiva Network
 I wanted to offer up an image of the complete(?) network after all of the kind interest in the preliminary network map I put together yesterday.
From the feedback yesterday, I learned my lesson and have linked to a high-res version of the image.
Kiva Micro-Lending Offers API
 Incredibly great idea Kiva.org, the distributed micro-lending organization, has recently released a freely available API for accessing their data.
I have just started poking at the data available, as I suspect network analysis will be able to help predict rates of return.
Good on ‘ya Kiva!
Update: hi-res image by request from smoovej
Demographics Fail
We forget, now that our reach is wide, that all purchasing is done by individuals. Since we don’t know the individuals, and locating and selling to each and every one of them (us) is too expensive, we developed marketing to help us select the people, the individuals, most likely to purchase whatever we are selling. We do that by carving up the population into demographic segments. We do that by creating images and messages our testing tells us will appeal to those demographics. As you noted, I am using the word “demographics” loosely – as it can just as easily mean single white 18-24 year-old men when selling video games, as it can mean general practitioners in the rural parts of beef exporting states when selling Lipitor.
 But, why is this important? Demographics provide us with statistically probable individuals. Using these expected values are a great way for describing groups, but the value breaks down when talking about individuals. We all know the story about the man who drowns crossing the river that is, on average, six inches deep.
The second failing in demographics is the pure focus on the individuals. If the goal of sales and marketing is to convince individuals to take action (purchase, vote, visit, etc.), demographics alone does not provide the context under which we, as social animals, make decisions.
The number one factor that we as consumers use in making purchase decisions in consumer packaged goods, automotive, everything is our peers. The younger we are, the better demographics reflect our peers, but that starts to break down rapidly once we leave school and enter the work force.
One place where we, as marketers, do a great job taking peer context into account is children’s toys. Think about how they are advertised. Is the latest and greatest StarBot 7000 action figure advertised with a static image of the figure with a voiceover talking about the high durability injection molded plastic construction and the die cast elbows capable of withstanding 30,000 hours of continuous play in -40°C conditions? No, they show bunch of kids running around having a great time with the StarBot. Children do not have long-standing deep networks of peers, so advertisers create a potential peer group in the advertisements. Even as children get older, more media savvy, and create deeper relationships with their peers, all parents will recognize the plaintive cry of, “But, Billy has one!” Continue reading “Demographics Fail”
Random Graph Generation in Perl
If you ever find yourself needing to generate random graphs in Perl (quite the ice breaker, I can tell you), I recommend checking out Matt Spear’s Graph::Maker, which has generators for everything from Erdos-Renyi and Watts-Strogatz to Lollipop graphs. The only downside is the use of Graph which is s-l-o-w for graphs of even moderate size, so makes using it directly for simulations of Social Networks out.

[Image from Wikipedia]

