NY Senate and Transparency

Congrats to the NY Senate for beginning to open more data at http://www.nysenate.gov/opendata!

Here is the network of Senator Allocations of Funding to Community Projects (CPFs): 2009-2010 by Senator or group and zipcode.  Line width is proportional to funding allocation.

communityAllocations

[click for full-size image]

Related: how do we define what’s public data? Some transit agencies are claiming copyright over transit performance.

Senator Allocations of Funding to Community Projects (CPFs): 2009-2010

Foreign Lobbying of NY Congressmen

Thanks to ProPublica and Sunlight Foundation:

…for the first time digitized one year’s worth of FARA records, making them accessible in a searchable database that allows users to easily follow the money and connect the dots. With the Foreign Lobbying Influence Tracker , anyone can quickly learn what governments are lobbying whom, how often and about what. [source @ ProPublica]

Here are the firms the Congressmen and -women from my home state have been meeting with:

Foreign Lobbying of NY Congress

and the countries of the governmental department or foreign firm paying the lobbyists:

NY Congress Lobbying by Country

Health Care Lobbyists Part Deux

Thanks everyone for showing the strong interest in the Lobbyist map.  I got a couple nice mentions at Mother Jones and LittleSis.org, but more importantly, I’ve added in all of the other names in the map.

Circles are people, squares are organizations, and white circles are the lobbyists in question.

If you’d rather the image than the flash bits, here you go, all 2.5MB of it.

A zoomable version of the earlier map is here:

[Thanks to Drew Conway for the Sea Dragon zoomable suggestion]

Best Networked Healthcare Lobbyists? [updated]

The Huffington Post, along with public contributors, has been collecting a list of former Congressional staffers turned healthcare lobbyists.  LittleSis.org has been keeping track of these former staffers, and thanks to their API, we now have a social graph of their relationships.

Former staffers in white (with names), and the rest of the visual field to show that some are MUCH better networked than others.

If there’s interest, I can add the names of the people they are networked with and start some analysis of the group.

HCIU Congressional Staffers Turned Healthcare Lobbyists

As always, click for a larger image.

Update: network map with all names, and in a zoomable widget here.

Healthcare and the Senate Finance Committee

Late last month, the NY Times had an article about the debate over healthcare legislation taking place in the Senate Finance Committee. Coincidentally, around that time, the folks over at LittleSis, the “free database detailing the connections between powerful people and organizations,” were kind enough to give me early access to their API (thanks Kevin and Matthew!).

So from NY Times:

To LittleSis:

namedHealthcareColoredLean

Of the named members in the photo, neither Tom Barthold nor Phil Ellis existed at the time in the LittleSis database, but it’s still showing a pretty networked bunch.

I’d like to see someone do this one better, and include donors.

Statistics::SocialNetworks Perl mod is live!

camelbookStatistics::SocialNetworks has just been uploaded to CPAN, and as it percolates through the system I put forward the question, “What are we going to do with it?”

My goal in getting a module into CPAN is easy access, and a starting point to where we can decide what tools we want, and not have to reinvent them every single time.  There’s good work beginning in R, Python, and probably lots of others, but I’m a Perl-guy and I’d like this to be an open and ongoing discussion.

Included so far, are measurements of the Burt Constraint, and the Coleman-Theil disorder index.

What would you like to see?

P.S. SNA of Iranian Gov’t

Election Influence by 527’s: Browsable Map

I wanted to put out what’s been done so far on making yesterday’s post more interactive. There’s an awful lot that could be better about this map. Particularly legibility of labels in the core (it’s just too dense). If you want to see names, I suggest looking at the edges of the map.

Michael Bommarito is looking into better layouts for legibility. And while you are waiting, I suggest getting your fill of everything he’s ever written.

The data was collected from OpenSecrets.org.

[21-Apr-2009: You should see a flash image above, but am having an awful time getting this to render on a Mac.  Works great on Linux (Red Hat Enterprise Linux).]

Influencing Elections: Network of Expenditures by 527s

OpenSecrets.org is offering free access to their collected data about political contributions, and in that vein, I’ve created a network of expenditures by 527’s*.  I am looking for a way to make this more detailed for your ease of exploration, so please stay tuned.

expends527

*Groups whose primary purpose is to influence elections are exempt from taxation under Section 527 of the Internal Revenue Code.  From NP Action.

Network Analysis Application to Game Theory (with Software)

When will network analysis provide additional insight into game theory? In a word: inequality.

There must be some form of quantifiable inequality in the game: access, strength of relationships, goals, etc.  This difference creates opportunities for the individual players to use information (or resource) asymmetries and broker to their benefit.

unequalrelationships1

On the left all of the arrows representing the relationships have the same weight, representing the same value, in both directions and between all nodes.  On the right, the arrows have different weights between nodes. The greater the inequality, the more effective the application of network analysis.

The relationships depicted could be import/export pairs ($ or volume), contract frequency, or even strength of social relationships. Do not underestimate the potential utility in measuring based on qualitative values, such as strength of relationships. Using them can not only be quite effective, but they can often be much easier to calculate than one might suspect at the onset.  Here’s why.

The analysis method I suggest looks at all of the weights relative to the originating node.  It does not matter whether you can accurately value A’s relationship to B versus B’s relationship to A, as long as you can compare A’s relationship to B versus A’s relationship to C.  From the point of data collection, even an intuitive estimation these comparative values will provide insight. Thus knowing A wants something from B more than A wants the alternative from C, is often sufficient.

Looking at the perspective of access, this is represented in the shape of the network as “holes” or gaps.  There are technical definitions, but it’s usually quicker to understand through an image. Compare:
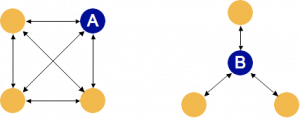
locationlocationlocationFrom the perspective of the two darker nodes A and B, they clearly have different opportunities to act as brokers based on the holes (or lack thereof) in the network.

Using the two of these together has shown some promising results.

Here is a simplified version of one of the tools I wrote to calculate the opportunity to act as broker based on the value of relationships and the network.  The TAR file contains the simplified program written in Perl, and two sample CSV network files: one similar to each network in the second image. The program relies on a module not yet indexed by CPAN, but is available there.

The calculation is called the network constraint, after Ronald Burt’s work.  The lower the constraint, the larger the opportunity to act as a broker, i.e. perform well in the game based on network structure.

I am in the process of requesting CPAN to host the Perl module, in registered space, so stay tuned.

[for an older version of the code, with some egregious bugs, but all in one place and no extra downloading, get it here]